JCS Analytics
JCS Analytics
  • Home
  • About
  • Privacy

JCS Analytics - We are analysts. We Ask. We Automate. We Discover.

Details
By J. Smith
J. Smith
Tableau
October 9,2023
Last Updated: 13 January 2024
Hits: 707
  • Tableau
  • Maps
  • Geographic Data Visualization

Leveraging Tableau for Geographic Data Visualization

Here are two examples of geographic data visualization using Tableau, a powerful tool for data analysis and visualization. The data used for these examples is sourced from Data Commons. The visualizations are simple, yet they effectively demonstrate the potential of Tableau's mapping capabilities.

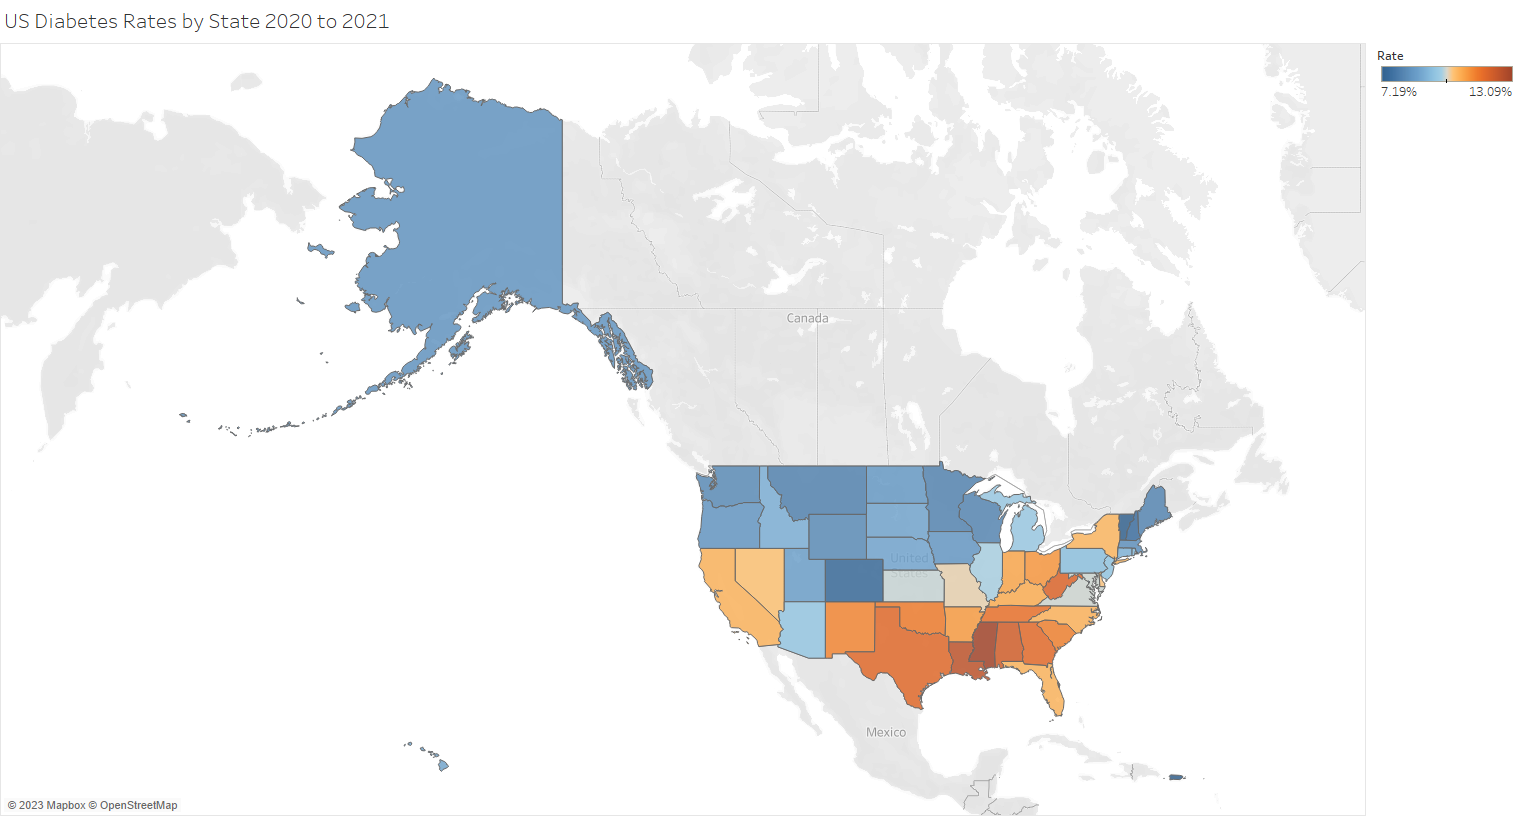
Visualizing US Diabetes Rates by State from 2020 to 2021

The first visualization is a map of the United States, color-coded to represent the rates of diabetes in each state for the years 2020 and 2021. This map provides a quick and clear overview of the geographical distribution of diabetes rates across the country.

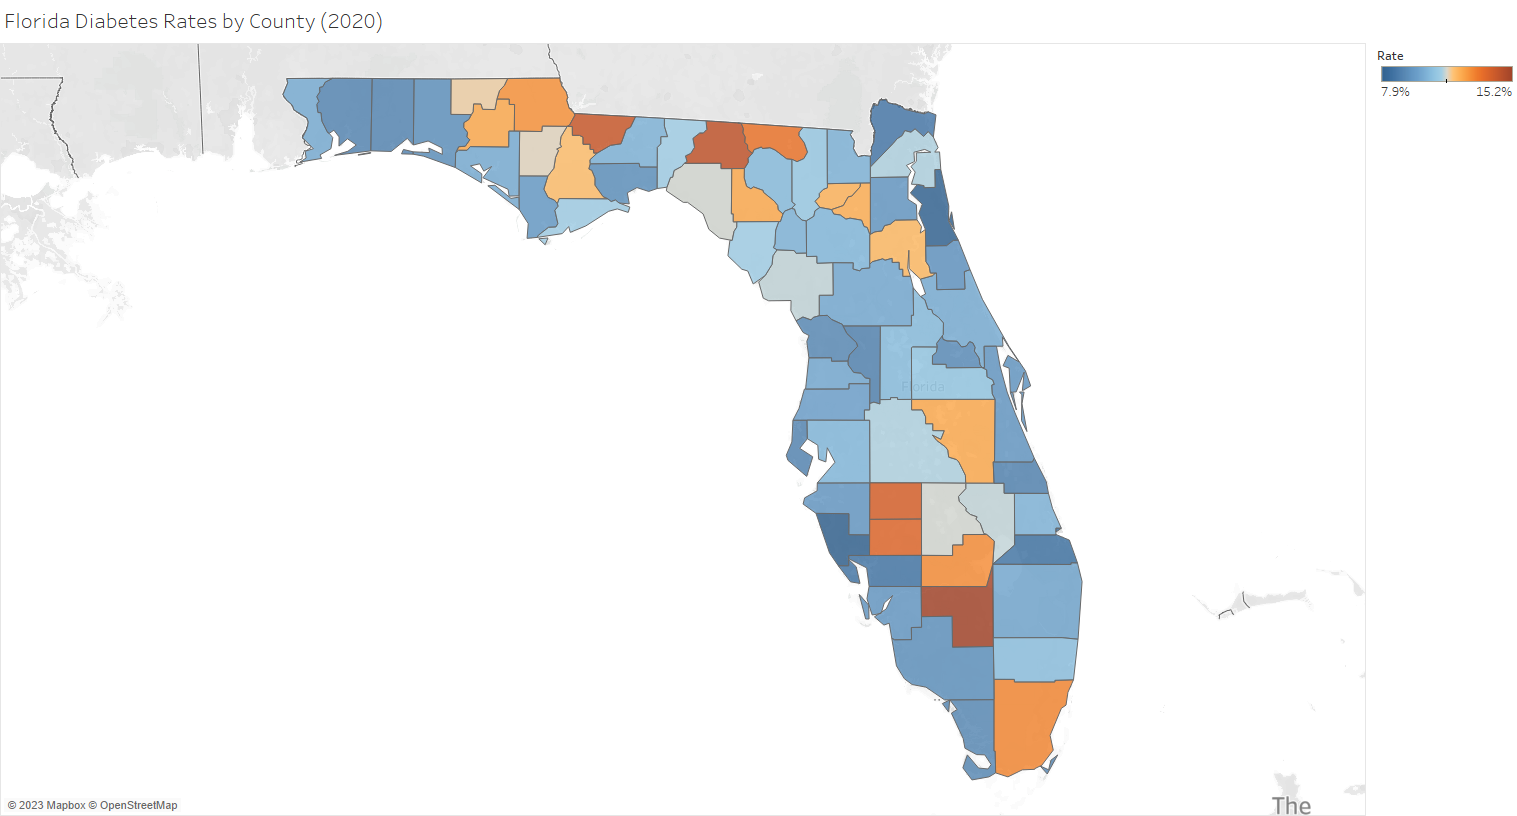
Visualizing Florida Diabetes Rates by County (2020)

The second visualization focuses on the state of Florida, with each county color-coded according to its diabetes rate. This map offers a more detailed view of the diabetes situation within a specific state.

In both maps, tooltips are used to display the data for each state or county. This approach keeps the maps uncluttered and easy to read, while still providing detailed information on demand. 

These examples illustrate the power and flexibility of Tableau's mapping capabilities. With Tableau, you can quickly create clear, informative, and visually appealing maps to enhance your data analysis and presentations.

Click on a map to see the visualization at Tableau Public.

Static Image


Static Image


Recent Activity

April 2026

  • Novo Nordisk Expands Its AI Strategy Through New OpenAI Partnership

Articles

  • 5K@EASD Race Results: Trends from 2023 and 2024
  • Adapting the 5K@ADA Race Results Project for 2025
  • Advanced Data Retrieval with Python
  • Aligning CGM and BGM Readings Using Python and Tableau
  • Analysis and Visualization of Public Health Agency of Canada COVID Cases
  • Bridging Data and Healthcare in the Nordics
  • Complex Web Scraping with Python
  • Creating a Calculated Field in Tableau to Get Get Data Aggregated by Month in the Correct Order
  • Data Analyst vs. Business Analyst: Similarities and Differences
  • Data Analytics for Type 2 Diabetes
  • Data Science and Responsible AI in the Pharmaceutical Industry: A Case Study of Novo Nordisk
  • Denmark's Leap into AI Innovation: A Model for Future Research and Development
  • Denmark’s Gefion AI Supercomputer Revolutionizes AI-driven Research
  • Eli Lilly’s AI Strategy: Opening High-Value Drug Discovery Models to the Biotech Ecosystem
  • Embracing AI: Balancing Augmentation, Ethics, and Environmental Impact
  • Enhancing Data Analysis and Visualization Workflows with AI
  • Exploring the 2023 5K@EASD Virtual Run: A Tableau Analysis
  • Exploring the Growth of GLP-1 RA Sales
  • How an Hour-by-Hour View Transforms Time in Range Insights
  • How Novo Nordisk is Utilizing AI for Drug Discovery

Top Subjects

  • Tableau
  • Python
  • Novo Nordisk
  • Data Analytics
  • Data Visualization
  • Tableau Visualizations
  • AI
  • 5K@EASD
  • Data Analysis
  • 5K@ADA
  • Type 2 Diabetes
  • Data Cleaning
  • Drug Discovery
  • AI Innovation
  • Quantum Computing
  • Diabetes Management
  • Race Results
  • Diabetes Awareness
  • Virtual 5K
  • Continuous Glucose Monitor
  • SQLite
  • SQLite Database Management
  • Continuous Glucose Monitoring
  • CGM Data Analysis
  • Artificial Intelligence
  • AI in Healthcare
  • Healthcare Data
  • AI in Drug Discovery
  • NVIDIA
  • DATETRUNC

Contact Me

Search

End Diabetes Stigma

5K@ADA

5K@EASD

World Diabetes Day

Rochen Web Hosting

Bluesky Social

  • You are here:  
  • Home
  • Tableau
 
Copyright © 2026 JCS Analytics. All Rights Reserved.
Joomla! is Free Software released under the GNU General Public License.