
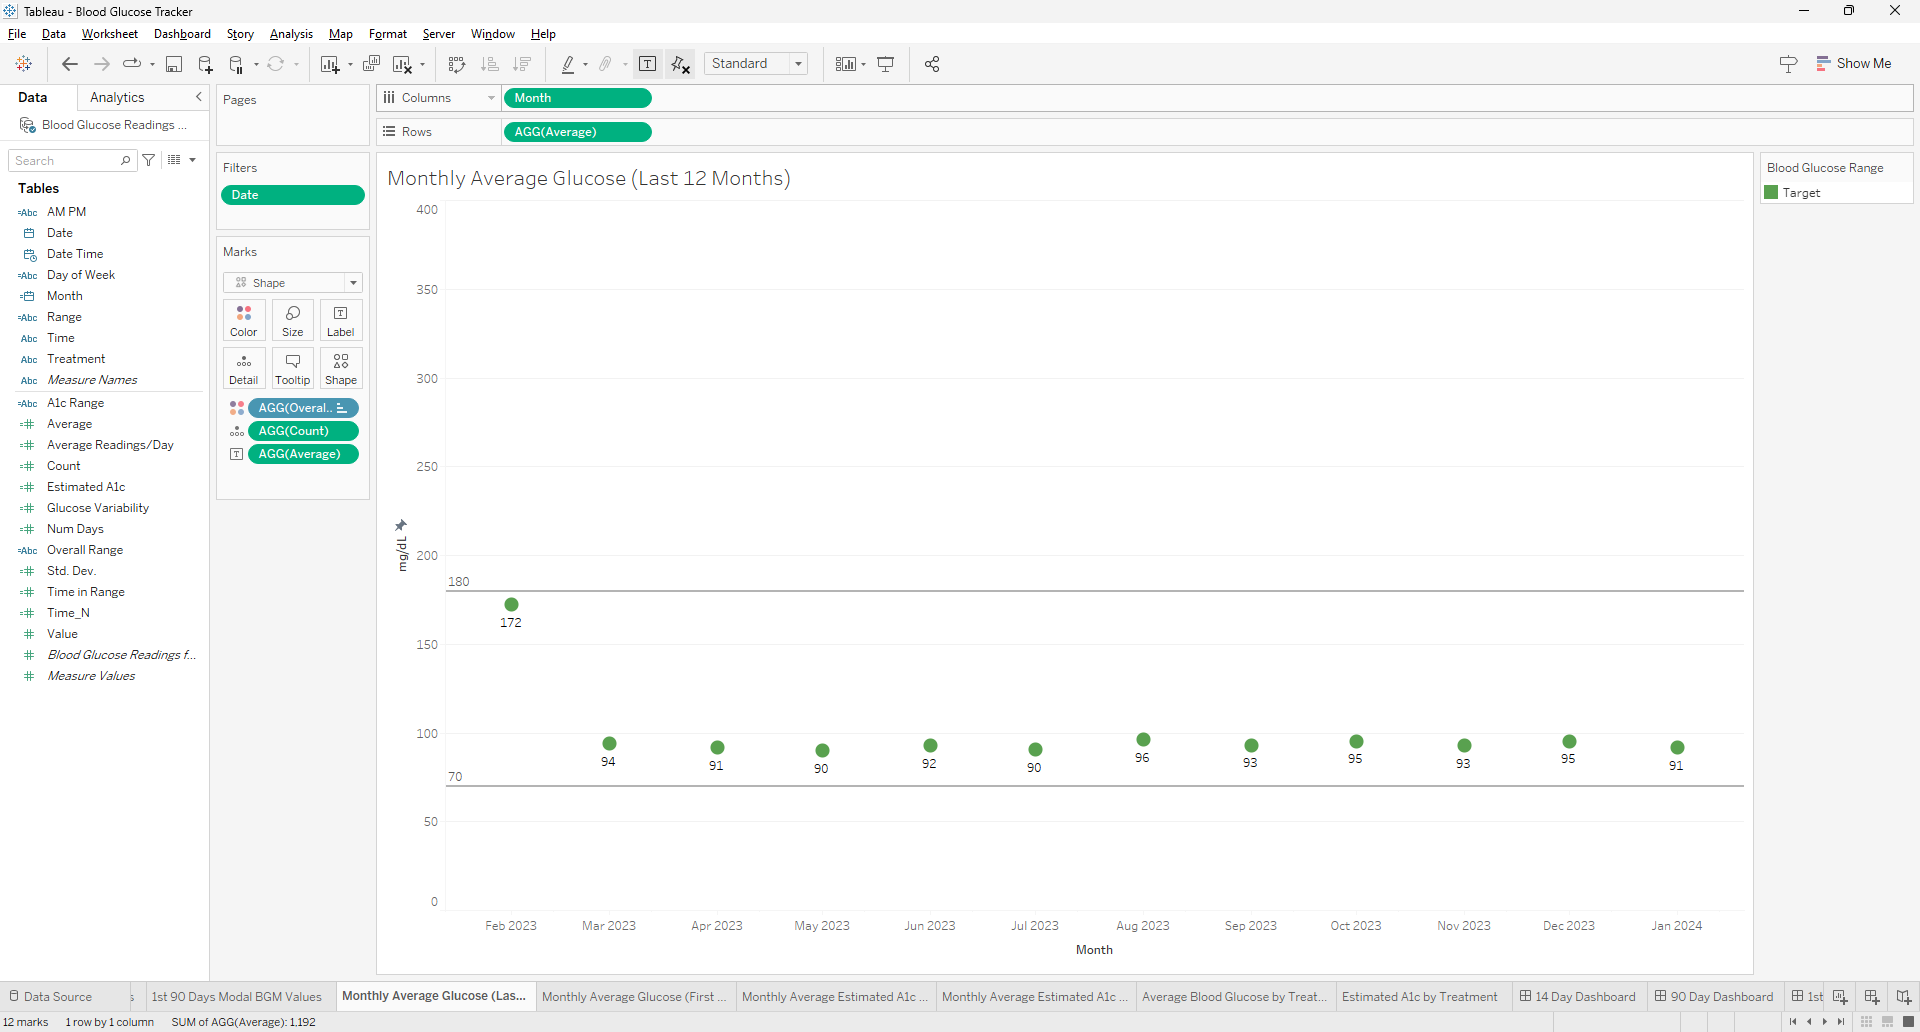
Creating a visualization for the most recent 12 months in Tableau can be a common requirement for time series analysis. To achieve this, you can use the `DATETRUNC` function to truncate your date data to the first day of each month, ensuring that your months will be in the correct order when aggregated. Here's how to use the `DATE(DATETRUNC('month',[Date]))` function effectively in Tableau for this purpose.
Understanding the DATETRUNC Function
The `DATETRUNC` function in Tableau truncates a given date to the specified date part, such as the year, quarter, or month. When you use `DATETRUNC('month', [Date])`, it will return the first day of the month for each date in your dataset. This is useful for creating consistent monthly data points for visualization purposes.
Steps
Benefits of Using DATETRUNC
Using the `DATE(DATETRUNC('month',[Date]))` function in Tableau is a powerful way to prepare your data for visualizations that require monthly aggregation. It ensures that your months are in order and that your visualization reflects the most recent 12-month period. This approach is part of Tableau's robust time series analysis capabilities, which allow for insightful trend spotting and variance analysis over time.
Frequently Asked Questions
Can this method be applied to other time units (like weeks or days) and if so, how would the approach change?
The DATETRUNC function can indeed be applied to other time units such as weeks or days. The approach remains similar, but the unit of truncation in the function needs to change (e.g., 'week' or 'day') to reflect the desired aggregation level.
How can you use the calculated field created with DATETRUNC in Tableau to compare year-over-year data?
To compare year-over-year data using DATETRUNC, you can create separate calculated fields for the current and previous years by manipulating the date part of your DATETRUNC calculation. Then, use these fields in your visualization to compare performance across different years.
What are the best practices for ensuring that the date formatting in the calculated field matches the rest of the dashboard elements in Tableau?
Best practices for consistent date formatting include setting the default date format in the data source, using calculated fields to standardize date formats, and applying consistent formatting settings across dashboard elements directly within Tableau's format options.
The 5K@ADA virtual 5K run/walk event is coming soon! Registration is open!
Registration is free.
The 5K@ADA Virtual Challenge will bring together people across the globe as well as ADA attendees to emphasize the need for increased physical activity to help prevent diabetes and diabetes complications. This disease awareness activity provides participants with the opportunity to raise public awareness about the importance of a healthy lifestyle in preventing and controlling diabetes.
The 5K@ADA is sponsored by Novo Nordisk and the American Diabetes Association (ADA). It takes place in conjunction with the ADA annual conference.
I do the walk on the treadmill at the gym. This way I can have my earbuds in, easily track my progress and not have any interruptions.
Upload your race time any time between the race start and end dates.
5K@ADA Virtual Challenge
https://www.ada5k.com/
June 18 - June 22, 2025
Registration is open. Personalized bibs are available 48 hours after signup.
Continue driving change in diabetes by running or walking the 5K@ADA in Chicago or from your home city!

The 5K@EASD virtual 5K run/walk event is coming soon! Registration opens Monday July 15.
Registration is free.
The 5K@EASD Virtual Challenge will bring together people across the globe as well as EASD attendees to emphasize the need for increased physical activity to help prevent diabetes and diabetes complications. This disease awareness activity provides participants with the opportunity to raise public awareness about the importance of a healthy lifestyle in preventing and controlling diabetes.
The 5K@EASD is sponsored by Novo Nordisk and the World Diabetes Foundation. It takes place in conjunction with the European Association for the Study of Diabetes (EASD) annual conference.
I do the walk on the treadmill at the gym. This way I can have my earbuds in, easily track my progress and not have any interruptions.
Upload your race time any time between the race start and end dates.
5K@EASD Virtual Challenge
https://www.easd5k.com/
September 7 through September 11, 2024
Registration opens July 15. Personalized bibs will be available August 7. Finisher certificates will be available September 8.
Continue driving change in diabetes by running or walking the 5K@EASD in Madrid or from your home city!
#EASD2024 #5KEASD #DiabetesAwareness #DrivingChange
Hello, fellow data analysts and fitness enthusiasts! I'm pleased to bring to your attention another fantastic opportunity to join a global movement that champions health, awareness, and community involvement: the 2024 5K@ADA Virtual Challenge!
What is the 5K@ADA?
The 5K@ADA Virtual Challenge is an inspiring event that unites people from around the world to highlight the critical importance of physical activity in preventing and managing diabetes. This event is a call to action, encouraging us to lace up our sneakers, hit our favorite trails, treadmills, or neighborhood streets, and make a significant impact in the fight against diabetes.
Why Should You Participate?
Participating in the 5K@ADA offers a unique blend of flexibility and community spirit. It's an opportunity to:
Event Details
How to Participate
Join the Movement
The 5K@ADA is more than just a virtual run/walk; it's a powerful statement about the importance of physical activity in the fight against diabetes. By participating, you're not only taking steps for your own health but also contributing to a global cause that can change lives.
So, whether you're looking to beat your personal best, enjoy a leisurely walk, or simply support a great cause, I invite you to join the 5K@ADA Virtual Challenge. Let's come together to #DriveChangeinDiabetes and show the world what we can achieve when we unite for a common goal.
Remember, every step counts, and together, we can make a significant impact. See you at the virtual starting line!
Frequently Asked Questions
Can I participate in the 5K@ADA event if I'm not a diabetic?
Yes, the 5K@ADA event is open to everyone, regardless of whether you have diabetes, to promote awareness and encourage physical activity.
Are there any age restrictions for participating in the virtual events?
The provided information does not specify age restrictions, suggesting the event is open to all ages, but it's always best to check the official event website for any age-related guidelines.
Can I walk the 5K instead of running, and does it count towards completion?
Yes, you can either run or walk the 5K distance for these virtual events, and both are considered valid forms of participation to complete the challenge.
Are there any registration fees for the 5K@ADA virtual challenge?
The announcement for the 5K@EASD indicates it's free to participate, but it's advisable to check the 5K@ADA's official website for any registration fee details.
Page 8 of 8


![]()

